Video of Internal Talk
The information in the video does have some slight errors and also some purposeful omissions. In particular I directly swerved all information relating to closures as I did not want to confuse the audience. Most of the slight errors are off-hand comments that I later fact-checked and learnt from. This video was posted with permission from the company I was working with at the time.
Text Walkthrough
Debugging in JavaScript is just like debugging in any other language. And for those who haven't experienced what debugging is: it is a representation of the current state of the currently executing program / script.
Why is it included in the language? ECMAScript JavaScript standard says that if the engine running JavaScript supports any type of “debugging facility” then it must be triggered by the debugger; call.
What is ECMAScript? It is a standard of JavaScript created and maintained by a company called Ecma International. All the major browsers fulfill the ECMAScript Standard.
Triggering the debugger can look like any of these:
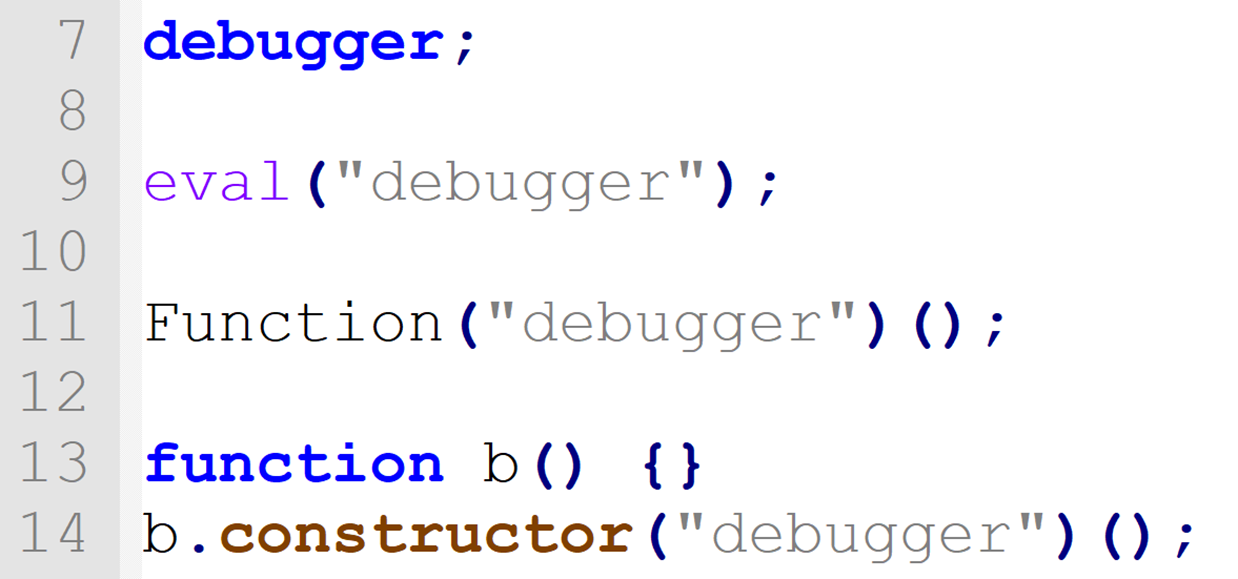
The first one is the only one that really needs to be written. If you come across any of the others out in the wild, delete them and replace them with the first one.
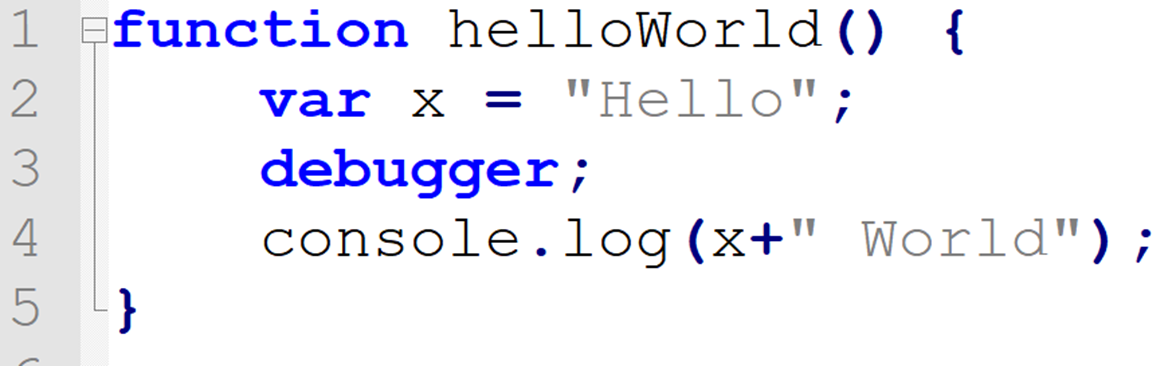
In an actual piece of code, triggering the debugger looks like this:
All major browsers implement their own ECMAScript engine:
Chrome uses V8, IE uses Chakra, Firefox uses SpiderMonkey, other browsers use other implementations. Because every browser has their own implementation, the different engines each have different performance on the same task/function call. This is why some features are available on one browser before they are available on all browsers.
This process is debugging in DevTools. As DevTools are only found in browsers (and things that have browsers, like electron etc.) this is also called debugging in the browser.
Of course that's not the only way, it is possible to debug JavaScript in Visual Studio. However it is generally not recommended, there are a few reasons why this is the case:
- Is notoriously hard to setup and configure
- There is a lot of misinformation due to different projects needing different settings
- Kinda works sometimes
- Is inferior to DevTools in browsers
Here is an example of some of the pitfalls when trying to get VS to debug javascript:
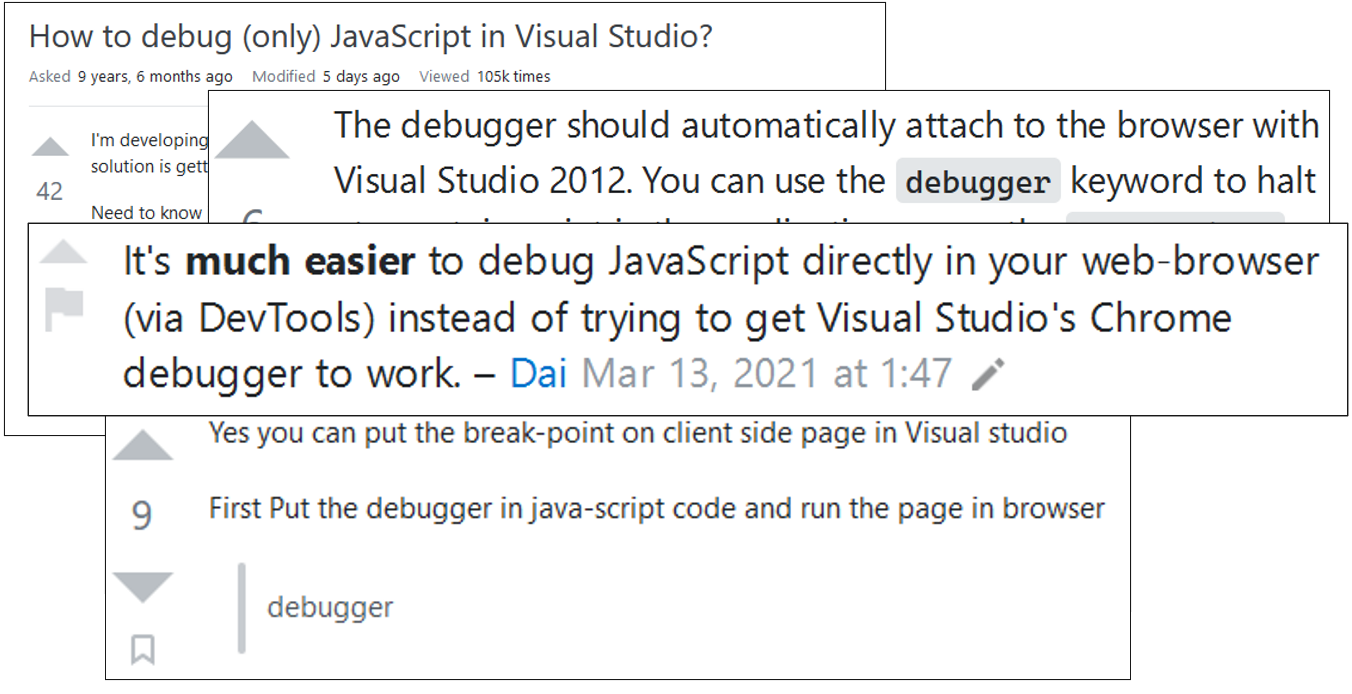
But this is just random people on the internet struggling to figure it out, what about the documentation from Microsoft? Well, MSFT says (paraphrased) that:
When trying to debug embedded JavaScript in cshtml breakpoints are not automatically hit.
That isn't terribly clear what that means at first read so lets unpack that a little bit. First let us look at the differences between what Embedded and External JavaScript is:
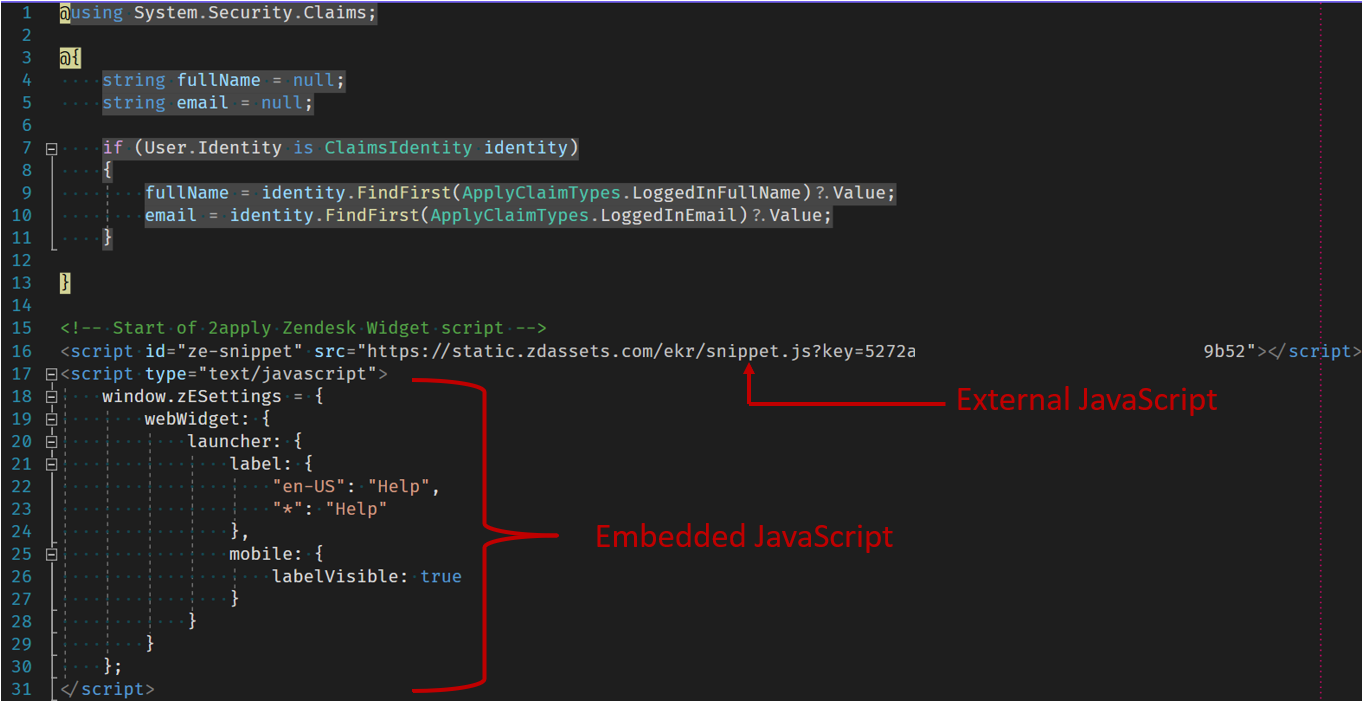
We can see above that JavaScript added to a razor file directly (that is, it's contained within a Script tag) is called Embedded JavaScript. JavaScript that is loaded from a file is called External JavaScript. Make special note that it does not matter whether the file is on the same domain name as the server that is running or the file is hosted on another domain name (like Google, or CloudFront or a CDN) - they are all called External JavaScript Files in this context.
Thus we can start to make sense of the sentence, any JavaScript contained within a cshtml file directly will not automatically be hit. Alright, well that sucks, but can it manually be hit?
Kind of... MSFT's documentation states that there are two ways to work around this issue. The first way involves bypassing Visual Studio and just writing in debugger; into the Embedded JavaScript and going through it in DevTools. The other workaround is to pull out all of that Embedded JavaScript and turn it into External JavaScript - which is a lot of work. Not great solutions.
Assuming that these solutions aren't terrible and are practical for your use case how is it done in Visual Studio? First step is to move all Embedded JavaScript into External JavaScript. Next go into the settings in Visual Studio and check Enable JavaScript debugging for ASP.NET (Chrome, Edge, IE).
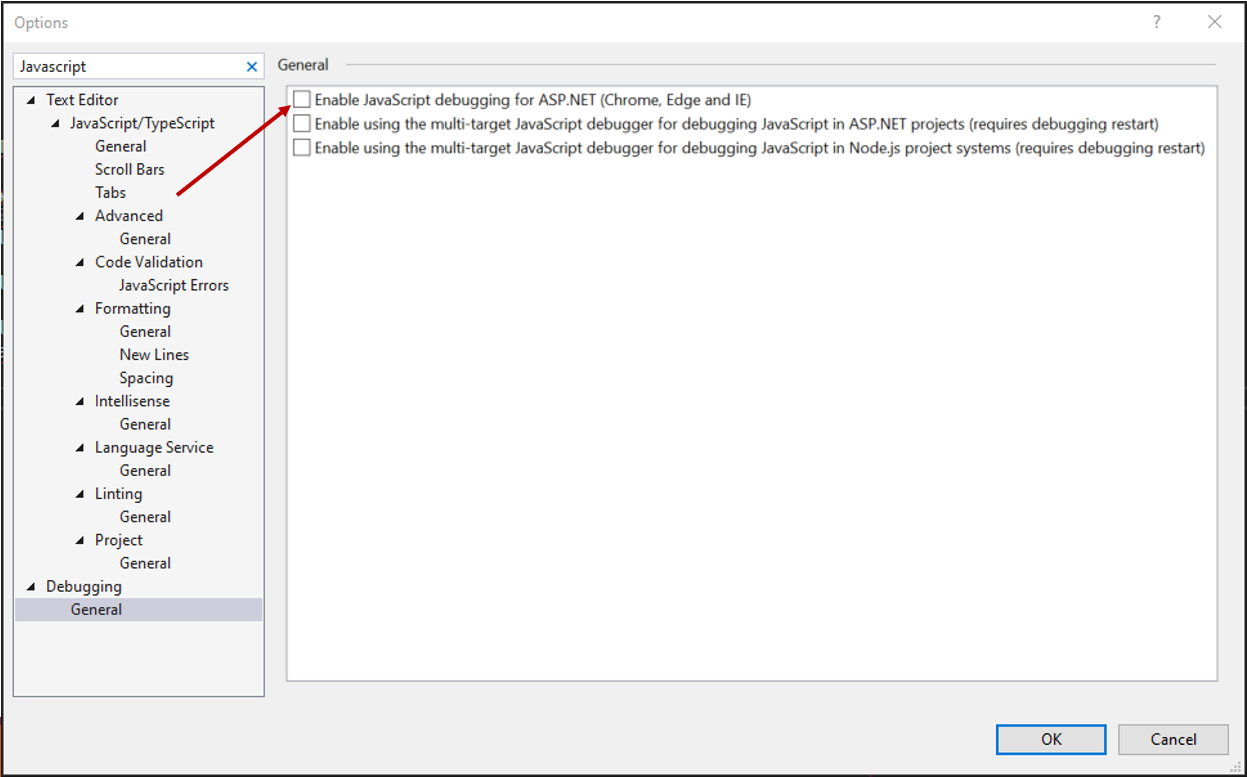
If you have a blazor setup or are running JS on the server and the client (as opposed to just the client) then check Enable using the multi-target JavaScript debugger for debugging JavaScript in applicable targets (requires debugging restart). If you don't know, just check it anyway.
You'll likely run into issues anyway, so best of luck troubleshooting as I'll be using DevTools, which is, in my opinion, the superior alternative.
Actually using the debugger in DevTools:
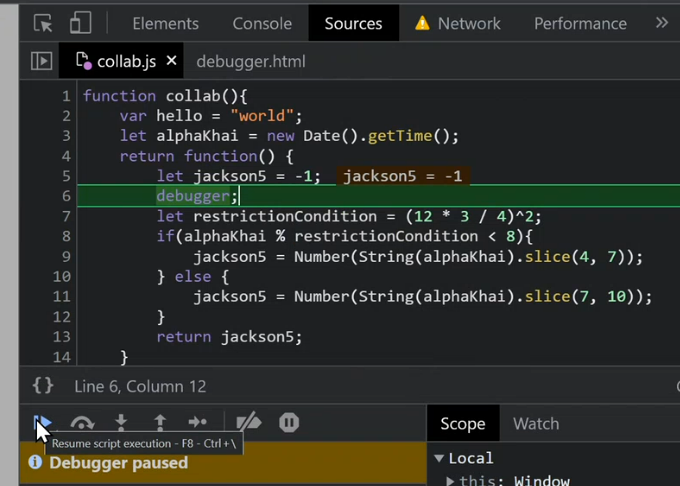
Once you have either Embedded or External JavaScript on a webpage that you can change all that needs to be done is to add the debugger; command to the file where you want the breakpoint to hit. For example:
function() {
    let jackson5 = -1;
    let restrictionCondition = (12 * 3 / 4)^2;
    if(alphaKhai % restrictionCondition < 8){
        jackson5 = Number(String(alphaKhai).slice(4, 7));
    } else {
        jackson5 = Number(String(alphaKhai).slice(7, 10));
    }
    return jackson5;
}
Once hit have access to the familiar debugger actions such as "Continue", "Step Over" and "Step In".
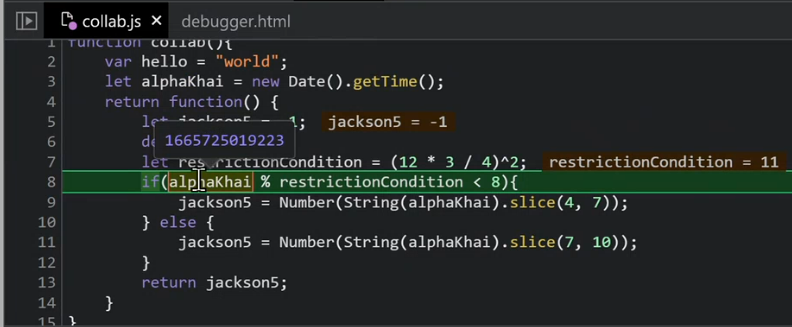
We can also inspect the values of variables in the current stack. This can be done by using the Local Scope window or by simply hovering over the variable name.
You can continue to make further changes to the source file and see how those changes impact the state of the debugger. This was a very high-level overview of the debugging process and there is way more to deep-dive into, here's some suggested further readings: